SRSG 300 bps Staggered Electrodes
(Left)
7.9kW (average)
A normally spaced electrode disc for a 300 bps SRSG, will give this simulated output with a peak voltage in the MMC of 32.22kV.
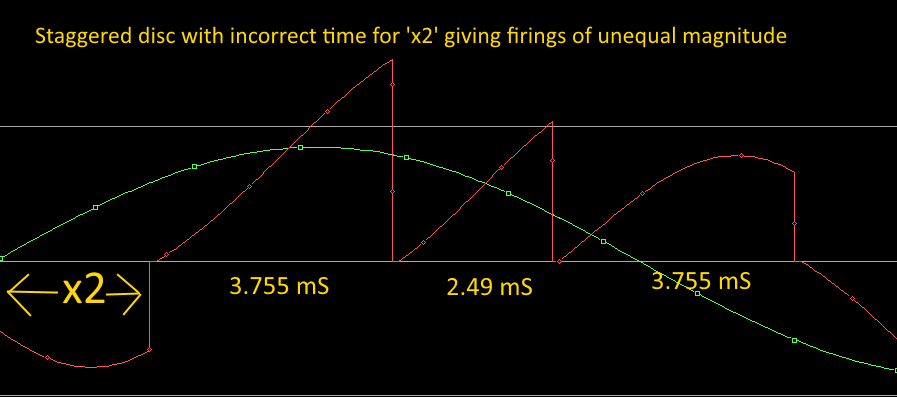
Both examples here use a 12 kV rms supply, but the staggered electrodes (the image below), although giving three firings of equal magnitude meaning a higher average power, gives much lower peak values.
8.5kW (average)
This simulated output of a staggered 300 bps SRSG's shows a 8.5kW average as opposed to the 7.9kW average of the normal disc shown above. The drawback though is that the peak voltage is now considerably lower, meaning less overall voltage going into the streamers, and less power for one in three of the firings. On average this should still give a worthwhile increase though.
For the full logic behind using 'staggered electrodes' see my page HERE
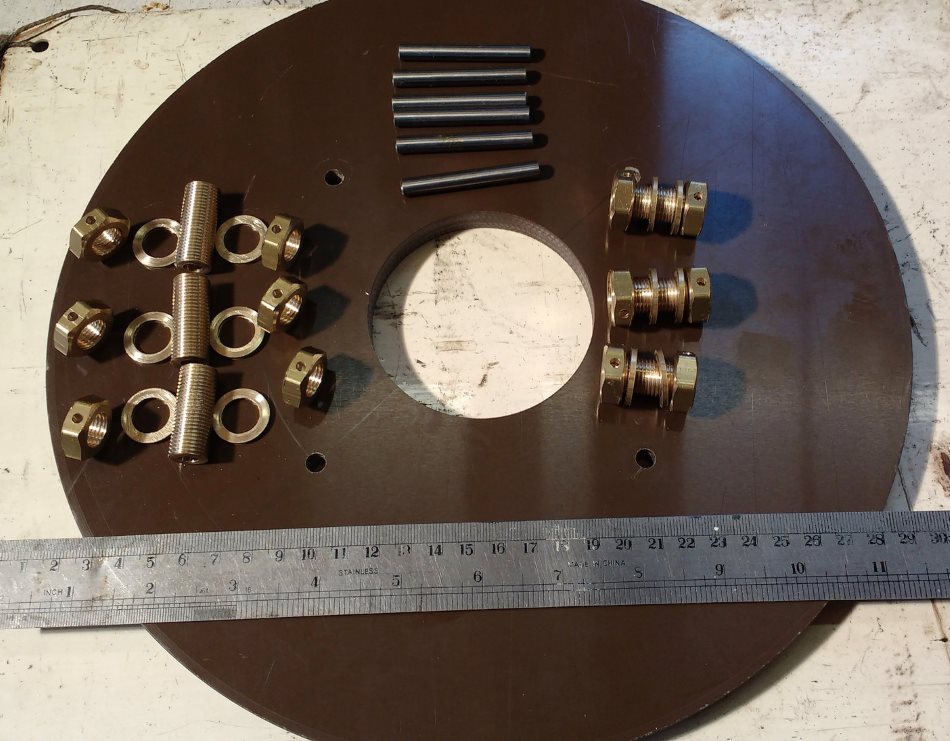
The angles shown in the first image of the completed disc (top of page) should give three equal levels of firing voltage (see video below) for a 300 bps synchronous coil.
However, as the images show below, the actual positioning of these timing intervals (x1 & x2) in relation to the zero crossing point of the mains frequency is the crucial factor, and that will depend on the ballast and MMC values being used.
This is where simulations play an important role and help you determine that position the easy way.
Both the simulations below have the same timing intervals, but the position after the zero crossing (x1 & x2) differs.
![]()
The shorter time period can be seen between the two longer periods.
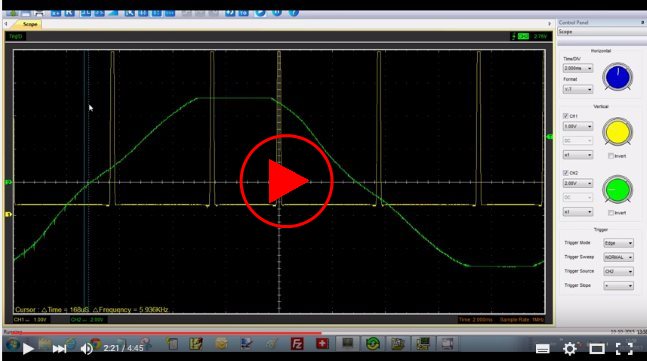
First I show the expected result using a simulation, then we see the actual output pulses from the SRSG while running.
This uses an infra-red beam broken by the electrodes.